This article is a general overview of the histogram lessons from the Lightroom for Landscapes Tutorials if you’d like to learn more on how to master the fantastic world of Lightroom.
The Histogram is Directly Connected to Your Tonal Sliders
If you ever wondered what exact tones you are adjusting with the basic panel sliders (exposure, highlights, shadows, whites, blacks), then the histogram can be of great assistance.
When you hover over the histogram with your mouse, notice that certain tonal groups will be highlighted. These “ranges” represent your five tonal sliders in the basic panel. They offer a visual representation of how many tones in your image are within each group.
You can also adjust these tones directly on the histogram. Place your mouse over the histogram until a tonal group becomes highlighted. Then click and drag your mouse left and right to make an adjustment to the corresponding slider in the basic panel.
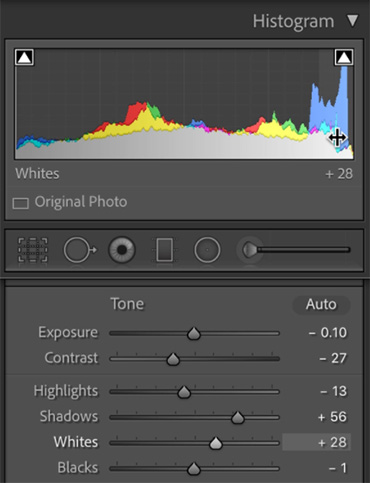
Histogram Tonal Groups
For example: if you hover over the “whites” group in the histogram and move to the right, your whites slider in the Basic panel will move to the right as well, thus brightening the lightness value of those particular pixels.
You Can Monitor Your Color Channels
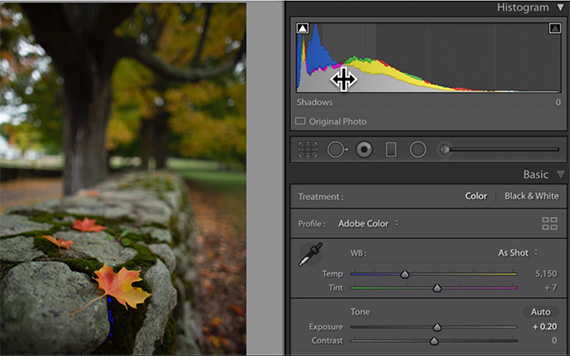
In color photographs that have not been converted to black and white, the histogram will also reflect the lightness values for each hue. This is helpful for identifying clipped detail for a specific color, which may not be reflected in the RGB (grey) histogram.
For example: in the RAW file above, you can see that the blue color histogram is vastly different from the RGB histogram—especially for the shadows. This tells you that the blue color channel has more of a risk of being clipped and will need to be monitored in order to preserve detail in that color… especially when you start to make shifts in the HSL panel.
This becomes especially helpful for sunrise/sunset photographs since those environments will typically clip the yellows and reds long before your other colors.
The Tone Curve Will Show the Exact Value of a Sampled Pixel
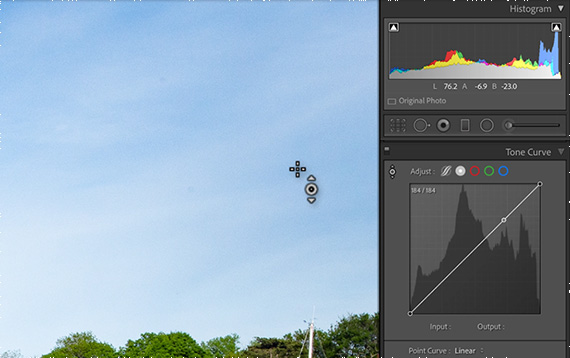
When using the tone or point curve, you’ll notice that the histogram for your selected image is in the background. While this reference is helpful for making your tonal adjustments along the curve baseline, it’s also useful for sampling the value of a specific pixel.
Select the target adjustment tool and hover over your image. You’ll see a moving dot appear on the baseline of your tone/point curve, showing you exactly where that pixel falls on the value scale (0-255).
This is particularly helpful on color images, where the hue can influence how light or dark a pixel appears.
You Can Monitor Clipped Color Detail
Most Lightroom users know that the histogram can help to identify clipped pixels if you turn the clipping warning indicators on. Press “J” to toggle this feature on and off, and Lightrroom will automatically show you clipped shadows as a blue overlay and clipped highlights as a red overlay.
However, you can also monitor clipped highlights and shadows with a black or white mask—which is especially helpful if you want to know the exact color channel(s) a pixel is being clipped in.
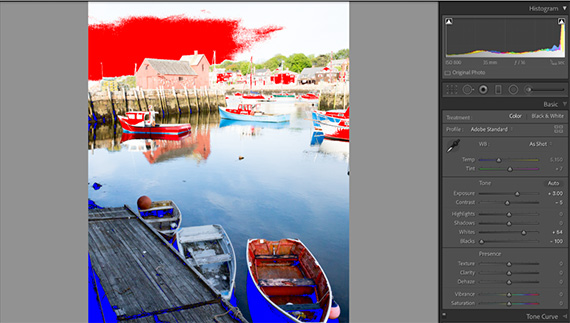
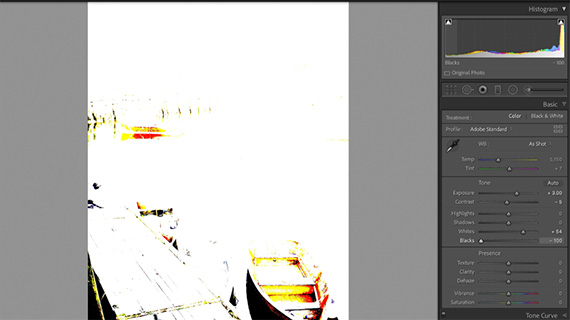
While hovering over a specific tonal group in the histogram (exposure, highlights, shadows, whites or blacks), press and hold the “Alt” key as you adjust those sliders. A black/white overlay will appear over the image, and any clipped detail will become highlighted in either white or black (or the specific color channel).
While adjusting the blacks in the histogram, a white overlay will appear. Here you can see that some shadows are being clipped globally (highlighted in black), while other shadow pixels are only clipped in the red and yellow channels.
Not only will you instantly know which color channel is being clipped through live feedback, but the black/white mask makes it easier to identify those pixels.
This feature will also work when holding the “Alt” key and adjusting the corresponding sliders in the Basic panel.
You Can View the LAB Color Values
If you like to work with the LAB color space, then you’ll greatly appreciate the ability to see the LAB value of any pixel in your photograph.
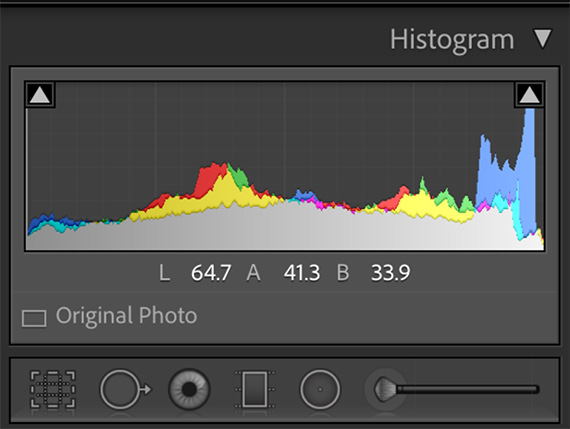
While hovering over your histogram, right-click to open up a context menu to customize the histogram. Make sure that “Show LAB Color Values” is selected, and you will now see the LAB value of a pixel when you hover over it, as seen below.
Even if you do not work in the LAB color space, I still recommend using this feature as you can instantly see the Lightness value (L) of a pixel.
For Further Training:
This article is a general overview of the histogram lessons from the Lightroom for Landscapes Tutorials, but barely scratches the surface as to what is possible. The full course will walk you through all of the extraordinary tools and techniques that Lightroom Classic has to offer:
Lightroom for Landscapes is currently 70% off today if you want to take a look. The offer also comes with 3 bonuses: full workflow videos, creative assignments and lifetime access with updates.
Deal ending soon: Lightroom for Landscapes at 70% Off
Like This Article?
Don't Miss The Next One!
Join over 100,000 photographers of all experience levels who receive our free photography tips and articles to stay current:





Leave a Reply