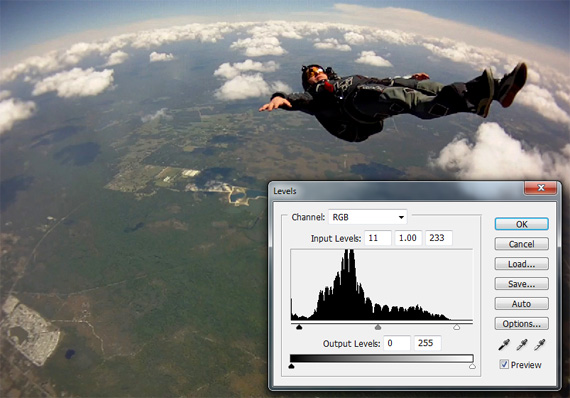
In digital cameras, we all talk about settings like brightness, exposure, contrast, and white balance very frequently. But still, if we are questioned about what all these settings actually mean and how they are different from each other, we may end up confusing ourselves. To bring our confusions to an end, we have histograms. They provide the simplest mechanism to make us understand, observe, differentiate and tune these settings.
To understand histograms, consider a black and white image with 256 gray levels. This means that each pixel represents one of these 256 levels. Now we could make 256 piles for the 256 gray levels, where each pile contains the number of pixels whose value is equal to the corresponding gray level. The histogram thus formed would show the gray level distribution of the picture. The levels close to 0 represent shadows, the levels close to the middle of the range represent midtones, and the levels close to 255 represent highlights.
Now let us learn how we can get an idea of this picture’s brightness, exposure, contrast, and white balance through the histogram.
Brightness
- If all the pixels stack upon the pile of level 255 (highest), it means the image is purely white, i.e. image brightness is maximum.
- If all the pixels stack upon the pile of level 0 (lowest), it means the image is purely black, i.e. image brightness is zero.
- If more pixels stack upon the piles representing higher gray levels, it means overall brightness of image is high.
- If more pixels stack upon the piles representing lower gray levels, it means overall brightness of image is less.
Exposure
- If there are lots of pixels stacked upon the piles of level 0 and near 0, it means it’s an underexposed image. Such a histogram indicates clipped shadows.
- If there are lots of pixels stacked upon the pile of level 255 and near 255, it means the image is overexposed. Such a histogram indicates clipped highlights.
The last two histograms for exposure show that lots of image data is at the boundaries of gray levels, which means that there is much data which camera could not capture and clipped to 0 or 255 levels. This means that the dynamic range of the actual scene is beyond the dynamic range (0 to 255) of the camera. But please note that this point holds valid provided there is not much pure black or pure white actually in the scene. For example, if we shoot a purely black wall, there will be lots of gray level 0 pixels and thus we cannot call this picture underexposed. The same will be the case when shooting a purely white wall and we won’t call that picture overexposed.
Contrast
- If the image has both clipped shadows and clipped highlights, the image has too much contrast.
- If the dynamic range of image does not cover the complete 0 to 255 levels and majorly contains midtones, the image has too little contrast.
The concept explained above is generalized to colored pictures by having separate gray level histograms for red, green, and blue pixel data.
White balance
Finally, let us learn how to relate histograms with the image’s white balance. Take a gray card or some neutral color object. You can see a spike in the red, green, and blue histograms when you shoot this gray card. If the spike in all the three histograms is at the same place, then the image is neutral. Otherwise, you will need to adjust the white balance of the image. For example, if the blue channel is much towards highlights, then the scene is too bluish and you should adjust the white balance accordingly.
So we see that proper understanding and use of histograms in photography makes our lives much easier.
About the Author
Archna Gupta
Working as a phone-camera sub-system architect.
Email: archna_it@yahoo.com
Like This Article?
Don't Miss The Next One!
Join over 100,000 photographers of all experience levels who receive our free photography tips and articles to stay current:


A great explanation, many thanks
For some more check out an excellent 3 parts, beginners guide for Histogram Adjustments with MATLAB: http://imageprocessingblog.com/histogram-adjustments-in-matlab-part-i/
Thanks for this. I’ve been pretty well guessing when adjusting colour balance, contrast etc. I’ve had a fair few times when I’ve made adjustemnts based on my eye and been dissapointed when looking back at it the next day. I’ll be checking my histograms while working up my photo for tonights post and all those going forward!
Thank you so much for the detailed explanation. From now on, I know what to look for when I see the histogram on my nikon d80.
I learned two new things reading this tutorial – and that was a very pleasant surprise! Thank you!
This is the best explanation I’ve read on any blog or photo web site in regards to the histogram and how to use it. My guess is because I’m a numbers guy, and reading the explanation in numerical terms makes more sense to me. Thank you very much for sharing this information with all of us.