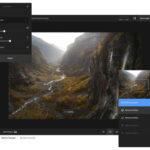
So you’ve heard of histograms and been told that they’re important. But why? Steve Perry explains:
What’s a Histogram?
The simplest way to explain a histogram is that it’s a graphical representation of the light levels in an image. The histogram chart that you see on the back of your camera is a luminosity histogram. A normal luminosity histogram will take a normal color image, convert that into grayscale, and then divide that into 256 levels of brightness: 0 to 255. Zero represents pure black, and 255 represents completely washed out white. Every other shade is represented as some shade of gray.
The software inside the camera then plots that information by representing each pixel according to the level of brightness that it represents and produces the histogram chart. Brighter pixels gets placed on the right, and darker pixels get placed on to the left.
The mid-tones are placed in the middle. The height of each tone represents how many pixels there are of that particular tone.
There is no generalization as to how the histogram of each image will appear. It will vary from image to image. Over time you should be able to tell how a histogram of a particular image is going to look. The lighter the tones, the more the histogram is going to be stacked toward the right and vice versa.
The histogram represents the actual tonal value in your image.
Clipping Shadows or Highlights
If a histogram is stacked on the extreme right or left, that means you’ve either captured extremely bright highlights or completely black areas. Both without details. Shadow details can still be recovered during post-processing, but it’s next to impossible to recover details out of blown out highlights.
Another thing to keep in mind is that when you review an image at the back of the camera, even if that image was shot in RAW, you’re actually looking at a JPEG image that was created by the camera. There might be some clipping in that image. But knowing that a RAW image has a lot more information than a JPEG image, there is always room for some recovering.
One way to ensure you have a reasonable representation of the actual tonal value is to have a less contrasty or flatter profile when shooting.
Why Are Histograms Important?
The processed JPEG preview that you see on the back of your DSLR is a misleading way to check for proper exposure. For one thing, ambient light conditions can fool you into thinking that the exposure is too bright or too dark. Your camera’s LCD brightness can also be to too dark or too bright, which can affect your judgement as well. For example, when shooting in extremely low light conditions you might think that the exposure looks great on the LCD, but in actuality, the LCD appears very bright in low light.
Histograms, on the other hand, do not vary based on the conditions and that means they give a more accurate representation of the ambient exposure.
How to Enable Histograms on Your Camera
To enable histograms on a Nikon camera, head up to the playback menu, then select Playback Display Options. Next, select Overview, and then finally, select the right select option to check the box. Then press OK to enable the histogram.
After having snapped a photo, simply press up or down on the multi-selector button and you’ll be able to see the histogram for the photo.
For Canon users, pressing the Info button during Image Review reveals the histogram.
Do you use your histogram? Why or why not?
Like This Article?
Don't Miss The Next One!
Join over 100,000 photographers of all experience levels who receive our free photography tips and articles to stay current:


I still don’t get it… So instead of actually looking at the picture itself to see if it looks good, you look at histograms?? Why would you do that??